| This interpretation of the table used by the defense in United States v. Gotti, et al. 1987 is based on my thoughts during a lecture given by Edward Tufte. In his book, Envisioning Information (p.31), Tufte reproduces the exhibit used by Bruce Cutler and Susan G. Kellman in an attempt to discredit the government's key witnesses in the case. (I will attempt to secure the rights to copy this document for comparison in the near future.) The premise of the original table is to highlight the various illegal activities of each key witness and thus to imply that they cannot provide credible testimony.
The premise of my interpretation of the data is an imagined rebuttal by the prosecution after the defense's initial attack. In reconstructing this table, I have taken creative license in two significant ways:
1) the original table used a single X in a spreadsheet cell to cross-reference various crimes with witnesses; however, it is likely that some of the crimes were committed more than once. Thus I have entered some completely fictitious numbers to suggest the effect this data might have had on the government's case.
2) I have invented a series of categories that each listed crime might fall into (more about the reasons for this later). Since I'm not a lawyer, the categorizations are somewhat arbitrary.

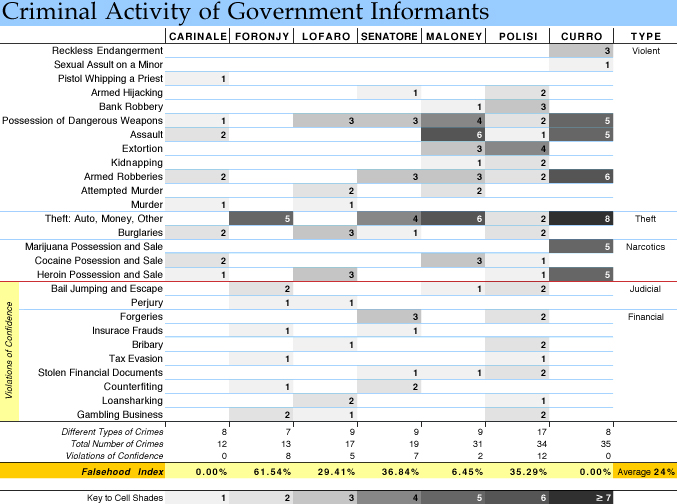
One of the most obvious features of my version of the table is the lack of typical spreadsheet grid lines and the use of shading to visually highlight the number of imaginary occurrences of each cross-referenced crime. Lighter cells indicate fewer instances and darker cells indicate more. The shading scale is noted in a legend that appears at the bottom of the chart (which also reinforces the quantitative horizontal sorting detailed below).
The quantities of criminal activities by each witness are totaled below the main body of the table. Each column is summed in terms of the number of total occurrences and the number of different types of crimes. The names of the individuals were then horizontally sorted based on the total number of crimes. Please recognize that I invented these numbers in such a fashion as to question the assumption that an individual who committed more types of crimes had necessarily committed more crimes. These numbers not-so-coincidentally also support the hypothetical prosecution strategy that I'm about to suggest. (This is only an exercise!)
 The most significant revision for the benefit of the government's case is the stratification and summary totaling of "Violations of Confidence." Here we begin to realize a framework that can begin the argument that although each individual has an extensive criminal history, the number of crimes involving the violation of trust is far less than the defense might have wanted the jury to believe. This notion is further refined by the invention of a "Falsehood Index" which is a percentage derived by dividing the total number of individual crimes by the number of confidence-related crimes. The most significant revision for the benefit of the government's case is the stratification and summary totaling of "Violations of Confidence." Here we begin to realize a framework that can begin the argument that although each individual has an extensive criminal history, the number of crimes involving the violation of trust is far less than the defense might have wanted the jury to believe. This notion is further refined by the invention of a "Falsehood Index" which is a percentage derived by dividing the total number of individual crimes by the number of confidence-related crimes.
 The grand conclusion drawn from this hypothetical data is the averaged index figure of just 24%, which is highlighted in yellow-orange in the lower right corner of the table. The "truth" of this figure is supported by shading of the table's cells -- it is immediately obvious that the top section of the table is visually darker than the bottom. The grand conclusion drawn from this hypothetical data is the averaged index figure of just 24%, which is highlighted in yellow-orange in the lower right corner of the table. The "truth" of this figure is supported by shading of the table's cells -- it is immediately obvious that the top section of the table is visually darker than the bottom.
Certainly this argument cannot prove that the government's witnesses are being truthful. However, it might have been enough to help repair some of the damage caused by the defense's initial argument. Further, sometimes admitting more of a truth, especially when it is perceived as self-damaging, can work in a presenter's favor if it is properly controlled. In essence, the prosecution would be saying, "We know these are bad guys, so bad we're embarrassed to show you more details than they did, but that doesn't mean you can automatically assume they're liars."
In Envisioning Information, Tufte wrote: "Courtroom graphics can overcome the linear, nonreversable, one-dimensional sequencing of talk talk talk, allowing the members of a jury to reason about an array of data at their own pace and in their own manner." In fact, as Tufte points out via a reproduction of an article published in The New York Times, the table in question was a pivotal piece of evidence. It was the very last piece of evidence the jury asked to re-examine before reaching their verdict. That verdict was not guilty -- but who knows what might have happened if the jury had been able to also consider an alternate interpretation of the same data? |